
Methods guide · Quantitative image analysis
Fibrosis quantification: define the tissue denominator first
A collagen-area percentage depends on both the positive area and the tissue included in the calculation. Before comparing groups, define the biological region, exclusions and denominator, then review the measurement alongside the histology.
Start with the biological endpoint
Decide what the measurement is intended to describe: collagen-positive area within an entire section, a defined organ compartment or a sampled region. These are different endpoints. A whole-section measurement and a compartment-specific measurement should not be treated as interchangeable.
For an area fraction, the calculation is collagen-positive area divided by the predefined evaluable tissue area, multiplied by 100. The numerator must belong to that same tissue region. Record whether structures such as capsules or vessel-associated collagen are included; the decision depends on the biological question and is applied consistently.
The same positive area can produce different percentages
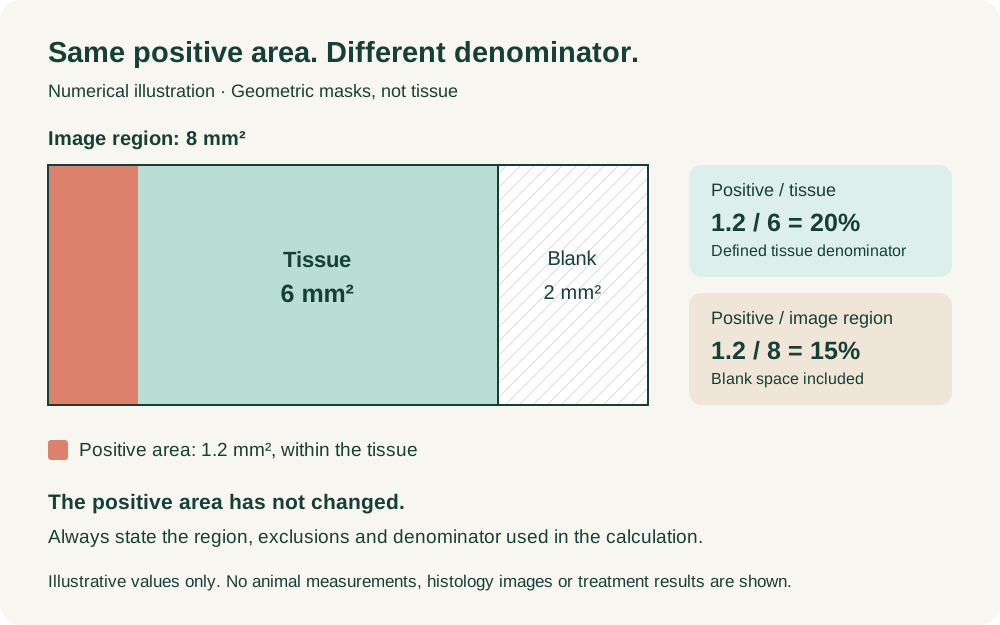
Consider a geometric illustration with 1.2 mm² of positive area inside 6 mm² of evaluable tissue. The positive tissue fraction is 1.2 ÷ 6 × 100 = 20%.
If the surrounding image region covers 8 mm², including 2 mm² of blank space, dividing by the whole image region gives 1.2 ÷ 8 × 100 = 15%. The positive area has not changed. Only the denominator has changed. These illustrative figures show why the denominator must be stated; they do not describe a treatment effect or a real specimen.
Separate tissue selection from stain classification
First define the evaluable tissue and agreed exclusions. Then identify the positive staining within it. Folds, tears, stain deposits, out-of-focus regions and other artefacts can affect either step; exclusions should be recorded rather than silently incorporated into the result.
In QuPath, annotations, thresholding or pixel classifiers can support these steps. Check which classifications contribute to the measurement. The official pixel-classification documentation explains that Ignore* classifications do not contribute to area measurements. Consequently, a reported percentage may refer to classified tissue rather than the whole annotation. Confirm this against the actual measurement definition and software version.
Review sampling and method performance
Examine representative overlays against the source images, including staining variation and difficult tissue regions. An attractive overlay on one image is insufficient evidence of performance across the study. QuPath's documentation discusses diverse training annotations, variation between images and the limits of local pixel classification.
Specify how sections and regions are selected and how their measurements are combined. If the animal is the experimental unit, multiple fields from that animal are subsamples. State the aggregation method: averaging regional percentages and dividing total positive area by total tissue area can give different answers when region sizes differ.
Report the measurement with its interpretation
Retain image and animal identifiers, regions, exclusions, numerator and denominator areas, percentages, software and analysis versions, and review notes. The reporting package can include representative overlays and an interpretation of the measured endpoint alongside the tissue findings.
A collagen-area fraction does not by itself describe fibrosis architecture or replace histopathological assessment. For a new project, send the scientific question, tissue and stain, representative images, sampling records and intended use. I can help define a practical measurement and review framework, with validation responsibilities and GLP or non-GLP arrangements agreed for the assignment.
References and further reading
Discuss your study
Send the scientific question, available material and target dates. We can agree a focused review or a broader assignment around your study.